Showing posts with label 4 colour. Show all posts

Solve a four colour diagram problem using an SMT (Integer) solver


This article is a development and simpler version of Colour a diagram with 4 collars using a Python sat solver  In the previous version binary logic was used to solve the problem ie. Is region 1 red ( yes or no ), Is region 1 Blue ( yes or no) etc. In this version of the problem integers are used to represent the colour for each region. 1=Red, 2=Blue, 3=Green, 4=Yellow.

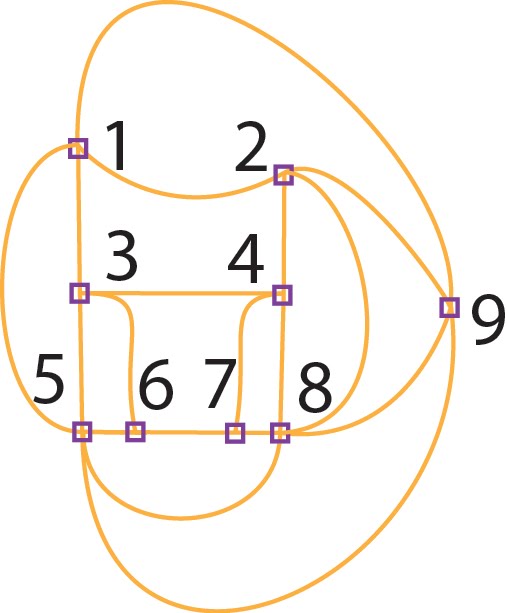
Take this simple diagram with regions marked 1 to 9. Given the constraint that areas with shared sides cannot have the same colour (touching corners is ok), how can this diagram be coloured with just 4 colours ? This type of problem was originally called called Guthrie's problem after F. Guthrie, who first conjectured in 1852 that "Only 4 colours are needed for any flat diagram."  Reference : Four Colour Theorem

Original Diagram


The first leap we take is to simplify the problem by translating spaces into dots and boundaries into lines.  This example diagram shows how any space can be represented by a dot and the boundaries between regions as a line. When each connected dot (which represents a region) has a different colour, we have our answer. Using points and lines, to represent areas and boundaries simplifies the problem without changing the constraints of the problem.


(Diagram from wikipedia)

From the starting diagram give each region dot a number then join those dots where regions share a boundary. Each of these lines should only cross one region boundary between two neighbouring areas. This completes the translation from map to (non-directional) network graph. Every boundary between two areas is crossed by a single line that joins the numbered points.
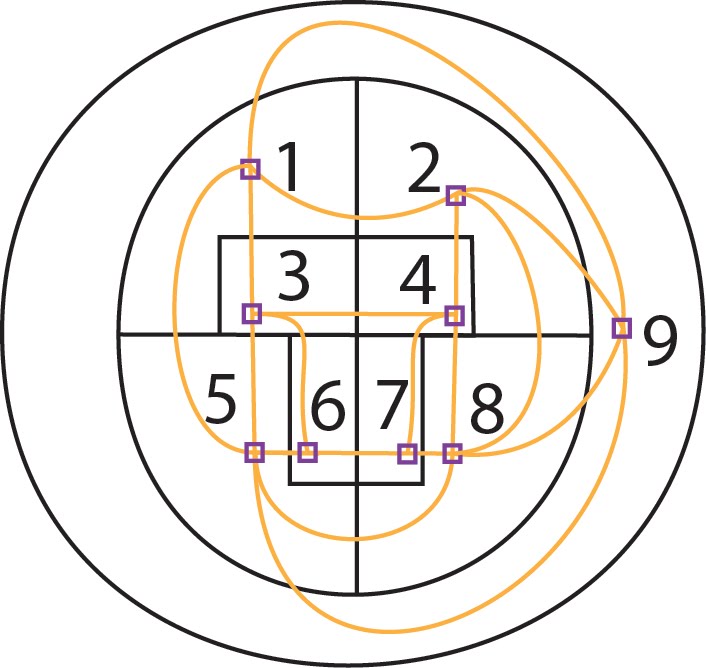


Netlist 1


We can list the boundary edges (yellow lines that join up dots) by using the start and finish region numbers.  For example region 1 has a boundary with region 2. This would be listed as ‘12’  and/or identically as  ‘21’ depending which end was used as the starting point. 

Each point generates one joining line for each neighbour. The number of lines that comes from any point must equal the number of boundaries with neighbour regions.

These lines are listed here as two digits being the boundaries between each region, each row showing the lines from each point :

PointIn contact withNumber of Vertex 
12,3,5,94
21,4,8,94
31,4,5,64
42,3,7,84
51,3,6,8,95
63,5,73
74,6,83
82,4,5,7,95
91,2,5,84
TOTAL

36 << Must be an even number as each line has two ends.


The Number of Vertex must equal the number of 0s in the matching row and column in the check matrix below.


This gives us the input data for the problem
1 2,1 3,1 5,1 9,
2 1,2 4,2 8,2 9,
3 1,3 4,3 6,3 5,
4 2,4 3,4 7,4 8
5 1,5 3,5 6,5 8,5 9,
6 7,6 3,6 5,
7 6,7 8,7 4,
8 2,8 4,8 5,8 7,8 9
9 1,9 2,9 5,9 8

This list could be easily simplified to remove duplicates ( 12 is effectively the same path as 21) by removing each entry where the second digit is smaller than the first.

This is where we have to take the next small jump and rephrase the connections into logical statements that describe the current graph situation in a way suitable for automatic solving. The structured language is SMTLIB version 2 than can be used as input to many different solvers such as Z3 and Math5. First we say each region must have one (but any) colour and then each region pairs that touch must have different colours.

The rules are generated as :
  1. Every region can have any colour value from the list of 1,2,3,4
  2. Regions that touch and share a border must have distinct, unequal colour values.

    The following lines are generated which set up the solver to use Integer logic and warn that we will need the actual values as answers. The for each region R1 to R9 an Integer value is declared and it's range is set to greater than 0 and less then 5 Ie: 1 .. 4


(set-logic LIA)
(set-option :produce-models true)
(set-option :produce-assignments true)
(declare-const R1 Int)
(assert (and (> R1 0) (< R1 5)))
(declare-const R2 Int)
(assert (and (> R2 0) (< R2 5)))
.....
.... R3 to R9 are also declared and set using similar lines. Next we set the constrains between the regions in the form that R1 and R2 must have distinct values. Finally the instruction file is completed with a request to check for an answer then finally show the answer value for each region.

(assert (distinct R1 R2))
(assert (distinct R1 R3))
(assert (distinct R1 R5))
(assert (distinct R1 R9))
(assert (distinct R2 R1))
(assert (distinct R2 R4))
.....
(check-sat)
(get-value (R1 R2 R3 R4 R5 R6 R7 R8 R9 ))
(exit)

The full file is then passed to the solver that will generate a line of "sat" or "unsat" depending on if the problem can be solved along with the colour assignments for each region.


$ ./makeSMT.pl | ../solver_m5 
sat
( (R1 4)
  (R2 3)
  (R3 1)
  (R4 4)
  (R5 3)
  (R6 4)
  (R7 3)
  (R8 2)
  (R9 1) )


Here is the list of colours to be applied to the regions for the solution. 

1=Red R3, R9
2=Blue R8 
3=Green R2, R5, R7
4=Yellow R1, R4, R6


A correct 4 colour solution.


Just a little harder

If we take the above problem and adjust the regions 3 and 6 we see the problem evolve. However adjusting the netlist to add the touching regions 3 & 2 and 6 & 8 the problem is solved using the same method.

Adjusted version of the problem above giving netlist 2

Solved !


A harder problem from Martin Gardner


This 110 region diagram was original proposed as requiring 5 colours as an April Fools joke. Lets see if we can generate a four colour solution. Starting with the diagram each region is numbered.


McGregor Map from 1975


Make a list of each region and just the *higher* numbered regions that they touch.


Extract the numbers and make some perl lines such as 


%regions_4 = ( #McGregorLines.txt
"R1", "R2,R3,R4,R5,R6,R7,R8,R9,R10,R11,R20,R100,R109,R110",
"R2", "R3,R12,R101,R102,R103,R104,R105,R106,R110",
"R3", "R4,R13,R12",
"R4", "R5,R14,R13",
"R5", "R6,R15,R14",
.......
From this data structure build the lines needed for an SMTLIB solver in the same way as for the smaller puzzle above but we have 110 regions which generates about 550 lines.

(set-logic LIA)
(set-option :produce-models true)
(set-option :produce-assignments true)
(declare-const R1 Int)
(assert (and (> R1 0) (< R1 5)))
(declare-const R10 Int)
(assert (and (> R10 0) (< R10 5)))
.....snip

(declare-const R98 Int)
(assert (and (> R98 0) (< R98 5)))
(declare-const R99 Int)

(assert (and (> R99 0) (< R99 5)))
(assert (distinct R1 R2))

(assert (distinct R1 R3))
(assert (distinct R1 R4))
(assert (distinct R1 R5))
.......snip

(assert (distinct R1 R109))
(assert (distinct R1 R110))
(assert (distinct R10 R11))
......snip
(assert (distinct R102 R103))
(assert (distinct R103 R104))
......snip

(assert (distinct R99 R109))
(check-sat)


(get-value (R1 R10 R100 R101 R102 R103 R104 R105 R106 R107 R108 R109 R11 R110 R12 R13 R14 R15 R16 R17 R18 R19 R2 R20 R21 R22 R23 R24 R25 R26 R27 R28 R29 R3 R30 R31 R32 R33 R34 R35 R36 R37 R38 R39 R4 R40 R41 R42 R43 R44 R45 R46 R47 R48 R49 R5 R50 R51 R52 R53 R54 R55 R56 R57 R58 R59 R6 R60 R61 R62 R63 R64 R65 R66 R67 R68 R69 R7 R70 R71 R72 R73 R74 R75 R76 R77 R78 R79 R8 R80 R81 R82 R83 R84 R85 R86 R87 R88 R89 R9 R90 R91 R92 R93 R94 R95 R96 R97 R98 R99 ))

(exit)

Present the SMTLIB file to the solver and gather the output. Both the Math5 solver and the Z3 solver were used to check the answers. Both the solvers take about 0.5s on a MacBookPro 2011 with a 2.2Ghz Core i7

sat
( (R1 4)
  (R10 1)
  (R100 2)
  (R101 1)
  (R102 3)
  (R103 1)
  (R104 4)
  (R105 3)
  (R106 1)
.....snip

Apply the colours to the original regions on the diagram ... both solvers appear to have created valid but different answers.

1=Red, 2=Blue, 3=Green, 4=Yellow.


M5 Solver


Z3 Solver


and Finally .....

Our favourite question came up on the game show The Chase last week.
Contestant said 6 but we know the answer is 4.


Colour a diagram with just four colours using a Python sat solver.

Take this simple diagram with regions marked 1 to 9. Given the rule that no two colours can touch edges (touching corners is ok), How can this diagram be coloured with just 4 colours ?
The first leap we take is to simplify the problem by translating spaces into dots and boundaries into lines.  This example diagram shows how any space can be represented by a dot and the boundaries between regions as a line. When each connected dot has a different colour, we have our answer. Using points and lines, rather than areas and boundaries simplifies the representation of the problem without changing the constraints of the problem.


(Diagram from wikipedia)

From the starting diagram give each region dot a number then join those dots where regions share a boundary. Each of these lines should only cross one region boundary between two neighbouring areas. This completes the translation from map to (non-directional) network graph.


We can list the boundary edges (yellow lines that join up dots) by using the start and finish region numbers.  For example region 1 has a boundary with region 2. This would be listed as ‘12’  and/or  ‘21’ depending which end was used as the starting point. 
Each point generates one joining line for each neighbour. The number of lines that comes from any point must equal the number of boundaries with neighbour regions.

These lines are listed here as two digits being the boundaries between each region, each row showing the lines from each point
12,13,15,19,
21,24,28,29,
31,34,36,35,
42,43,47,48
51,53,56,58,59,
67,63,65,
76,78,74,
82,84,85,87,89
91,92,95,98


PointIn contact withNumber of Vertex 
12,3,5,94
21,4,8,94
31,4,5,64
42,3,7,84
51,3,6,8,95
63,5,73
74,6,83
82,4,5,7,95
91,2,5,84
TOTAL
36 << Must be an even number as each line has two ends.
The Number of Vertex must equal the number of 0s in the matching row and column in the check matrix below.

This list could be easily simplified to remove duplicates ( 12 is effectively the same path as 21) by removing each entry where the second digit is smaller than the first.

Here is the list of colours to be used for the solution. 
Red
Blue
Green
Yellow
which are shortened to R,B,G,Y

This is where we have to take the next small jump and rephrase the connections into logical statements that describe the current graph situation in a way suitable for automatic solving. First we say each region must have one (but any) colour and then each region pair that touch must have different colours.

The rules are generated as :
  1. Every region can have any colour from the list of R,B,G,Y.
  2. Each region must have just one colour from the list R,B,G,Y.
  3. Regions that touch and share a border must have different colours

Generate rules for "Every region can have any colour from the list of R,B,G,Y".

This must be true ( region1=Red or region1=Blue ….… region1=Yellow ) AND ( region2=Red or … region2=Yellow) AND ( region9=Red or … region9=Yellow )

( 1R OR 1B OR 1G OR 1Y ) AND 
( 2R OR 2B OR 2G OR 2Y ) AND 
( 3R OR 3B OR 3G OR 3Y ) AND 
( 4R OR 4B OR 4G OR 4Y ) AND 
( 5R OR 5B OR 5G OR 5Y ) AND 
( 6R OR 6B OR 6G OR 6Y ) AND 
( 7R OR 7B OR 7G OR 7Y ) AND 
( 8R OR 8B OR 8G OR 8Y ) AND 
( 9R OR 9B OR 9G OR 9Y )

This perl snippet generates the lines for us.
$ perl -e ‘
for$i(1..9) { print("( ");
    for$j( R,B,G,Y)
        { print("$i$j"); print(" OR ") if($jne'Y') };
          if($i!= 9) {print(" ) AND ") }else{ print(" )”);
        }
    print("\n”)
};’

These phrases are reduced to a simpler form for the solver but the logic is the same. All the phrases in the generated list must be true.

$ perl -e 'for $i (1..9) { for $j ( R,B,G,Y) { print ("$i$j ") } print ("\n") }’ 

1R 1B 1G 1Y
2R 2B 2G 2Y 
3R 3B 3G 3Y 
4R 4B 4G 4Y 
5R 5B 5G 5Y 
6R 6B 6G 6Y 
7R 7B 7G 7Y 
8R 8B 8G 8Y 
9R 9B 9G 9Y 

Next we need to describe that each region should have only one colour using lots of this type of OR clause format that exclude a region from having two colours.  ~ stands for “Not" making ~R1 describe "Region 1 is not coloured Red"

~R1 OR ~B1

Simplified to 

~R1 ~B1

This statement can be interpreted as 
if  ( Region 1 is not red) or ( Region1 is not Blue) is true  
then 
    either Region 1 is not red and Region 1 is not blue  ( but could be any other colour)
    or       Region 1 is red and not blue (at the same time) 
    or       Region 1 is blue and not red (at the same time)

This mini statement or clause is created for all the regions across all the pairs of colours. 
There are 9 regions and four colours. 108 phrases that force each region to have just one colour. 

for$x(1..9) {
        for$i( R,B,G,Y) {
                for$j( R,B,G,Y)
                { nextif($ieq$j);
                  print("~$i$x~$j$x\n") unless$key{"$i$j$x"};
                  $key{"$i$j$x"}=1; $key{"$j$i$x"}=1; # Memorise and exclude done pairs 
          }}}

# no more than one colour per region
~R1 ~B1
~R1 ~G1
~R1 ~Y1
~B1 ~G1
~B1 ~Y1
~G1 ~Y1
~R2 ~B2
~R2 ~G2
~R2 ~Y2
~B2 ~G2
~B2 ~Y2
~G2 ~Y2
…. and so on for the rest of the regions

Finally we need to state which regions are adjacent and must not have the same colour. Read these clauses as

if either of ( Region 1 is not red)  or ( Region2 is not Red) is true  
then 
    either Region 1 is not red in which case Region2 can be red
    or       Region 2 is not red in which case Region1 can be red

We list all the colours for all the regions that touch.
The full list of touching regions ( in both directions ) is listed but only use one direction for each pair. 

$rtt="12,13,15,19,21,24,28,29,31,34,35,36,42,43,47,48,51,53,56,58,59,63,65,67,74,76,78,82,84,85,87,89,91,92,95,98";
foreach$r( split/,/,$rtt) {
        ($a,$b) = split//,$r;
        for$j( R,B,G,Y) { 
                print("~$j$a~$j$b\n") unless$b< $a
        }}

# Exclude each possible colour of each of the regions that touch
~R1 ~R2
~B1 ~B2
~G1 ~G2
~Y1 ~Y2
~R1 ~R3
~B1 ~B3
~G1 ~G3
~Y1 ~Y3
~R1 ~R5
~B1 ~B5
~G1 ~G5
… and so on for each touching pair

With all of the three sets of generated lines in a single solver input file 


$ python ../sat-master-Python/src/sat.py  < Allin_orig.txt
~R1 ~B1 ~G1 Y1~R2 ~B2 G2~Y2 ~R3 ~B3 G3~Y3 ~R4 B4~G4 ~Y4 ~R5B5~G5 ~Y5 ~R6 ~B6 ~G6 Y6~R7 ~B7 G7~Y7 ~R8 ~B8 ~G8 Y8 R9~B9 ~G9 ~Y9

Or in brief mode showing just the statements that are true.

$ python ../sat-master-Python/src/sat.py --brief  < Allin_orig.txt
Y1 G2 G3 B4 B5 Y6 G7 Y8 R9

1 Yellow
2 Green
3 Green
4 Blue
5 Blue
6 Yellow
7 Green
8 Yellow
9 Red

Which on the original daigram looks like this ..
Which is a correct 4 colour solution.

Alternative solutions can be found 

$ python ../sat-master-Python/src/sat.py  --brief --all < Allin_orig.txt| head
Y1 G2 G3 B4 B5 Y6 G7 Y8 R9
Y1 G2 G3 B4 B5 Y6 R7 Y8 R9
Y1 G2 G3 B4 B5 R6 G7 Y8 R9
Y1 G2 G3 B4 R5 Y6 G7 Y8 B9
Y1 G2 G3 B4 R5 Y6 R7 Y8 B9
Y1 G2 G3 B4 R5 B6 G7 Y8 B9
Y1 G2 G3 B4 R5 B6 R7 Y8 B9
Y1 G2 G3 R4 B5 Y6 G7 Y8 R9
Y1 G2 G3 R4 B5 Y6 B7 Y8 R9
Y1 G2 G3 R4 B5 R6 G7 Y8 R9

…..

Finally a double check using a contact table with proposed colours for the regions.
To Cross check using this table, Where there is a 0, the colour on the diagonal for the column and row must be different.

Cell colour table123456789
1Yellow00
0


0
20Green
0


00
30
Green000


4
00Blue

00
50
0
Blue0
00
6

0
0Yellow0

7


0
0Green0
8
0
00
0Yellow0
900

0

0Red


Making this test a little harder by changing the boundaries of regions 4 and 6. 
The current colouring is now incorrect as regions 3 & 2 are both Green and Regions 6 & 8 are both yellow.

The "regions that touch" list is extended to include

23
68

gives us an updated sat file with these lines added  

$ diff Allin_orig.txt  Allin_Better.txt
66a67,74
> ~R2 ~R3
> ~B2 ~B3
> ~G2 ~G3
> ~Y2 ~Y3
> ~R6 ~R8
> ~B6 ~B8
> ~G6 ~G8
> ~Y6 ~Y8

94a103,106  #These lines are moved down in the file but remain the same
> ~R3 ~R4
> ~B3 ~B4
> ~G3 ~G4
> ~Y3 ~Y4
103,106d114
< ~R3 ~R4
< ~B3 ~B4
< ~G3 ~G4
< ~Y3 ~Y4

Running the solver with the new input lines we get

$ python ../sat-master-Python/src/sat.py  --brief < Allin_Better.txt
Y1 G2 B3 Y4 G5 Y6 G7 B8 R9

1 Yellow
2 Green
3 Blue
4 Yellow
5 Green
6 Yellow
7 Green
8 Blue
9 Red

Which gives us a new colouring that works.

The above solution demonstrates a common simplification technique for turning an infinitely variable problem (any diagram, any number of subdivisions ) into simple logical statements that can be "satisfied" to generate a specific solution. 


Background Notes


Technique for map to graph translation. Put a blob in each area and join with a line to each neighbour blob. The letters on the blob indicate a common edge.

By Inductiveload - Based on a this raster image by chas zzz brown on en.wikipedia., CC BY-SA 3.0.


A set of regions of a map can be represented more abstractly as an undirected graph that has a vertex for each region and an edge for every pair of regions that share a boundary segment. This graph is planar (it is important to note that we are talking about the graphs that have some limitations according to the map they are transformed from only): it can be drawn in the plane without crossings by placing each vertex at an arbitrarily chosen location within the region to which it corresponds, and by drawing the edges as curves that lead without crossing within each region from the vertex location to each shared boundary point of the region. Conversely any planar graph can be formed from a map in this way. In graph-theoretic terminology, the four-color theorem states that the vertices of every planar graph can be colored with at most four colors so that no two adjacent vertices receive the same color, or for short, "every planar graph is four-colorable".[5]


code in swift to make the Sat lines
/*
#Enumuate the lines for a sat solver from a diagram
#in Swift
*/
let colours=["R","B","G","Y"]
print ("#Swift At least once colour for each region");
for i in 1...9{
  for j in colours {
     print ( "\(j)\(i)", terminator:"") }
   print ("") }

varkey=[String:Bool]()
print ("# no more than one colour per region");
for x in1...9{
  for i incolours {
    for j incolours {
        if(i ==j) { continue}
            if key["\(i)\(j)\(x)"] ==nil
              {
                    print("~\(i)\(x)~\(j)\(x)")
                    key["\(i)\(j)\(x)"]=true
                    key["\(j)\(i)\(x)"]=true;
              }
    }}}

print ("# Exclude regions that touch");
/* #first set
rtt="12,13,15,19,21,24,28,29,31,34,35,36,42,43,47,48,51,53,56,58,59,63,65,67,74,76,78,82,84,85,87,89,91,92,95,98";
#add touching regions 23 & 68
*/
letrtt=[23,32,68,86,12,13,15,19,21,24,28,29,31,34,35,36,42,43,47,48,51,53,56,58,59,63,65,67,74,76,78,82,84,85,87,89,91,92,95,98];
forr in rtt  {
  let a:Int  =r /10
  let b:Int  =r %10
  for j in colours {
    if a<b {
       print ("~\(j)\(a)~\(j)\(b)")
}}}


SMT Solvers, introduction and links (Start here with the readme)

Total Concentration from The Turing Tests - Expert Numbers puzzles, solved using SMT (Integer) solver.

Page 10 of the Expert Number Puzzle book gives us a straight forward "Total Concentration" puzzle to solve. This puzzle is also kn...